Model Interpretability
 Here's a hypothetical scenario that serves as a cautionary tale for the remainder of this section.1
A model, trained on a dataset of cars, predicts a car's top speed based on the following three features:
ColourNumber of doorsConvertible(binary value: 'yes' or 'no')
The model does very well for cars that are green, have two doors, and are convertible—the model predicts they have very high speeds, and surprisingly has a high level of accuracy.
A team of data analysts are puzzled by this ability and want to employ model interpretability methods to understand how important each of these features are to the prediction and their relative effects. It turns out that all of the features are important, but none of them are "explaining" why such cars are faster than others.
As you may have guessed, the real reason that the model is accurate in predicting a high top speed in such cases is because most of the cars that are green, have two doors, and are convertible happen to be Lamborghinis, which are known for their high top speeds.

However, none of the features in the model have any causal relationship with the top speed of a car. Rather, it is the engine (among other things) that is responsible for the top speed of a car. The other features are what we would call 'confounding variables'—they are not the cause of the top speed, but they are correlated with the cause.
Here is a diagram (reprinted from this article) that illustrates the problem:

What is a feature? What is a variable?
For those who are new to machine learning, the difference between 'features' and 'variables' can appear confusing, especially because the two are sometimes used synonymously. However, the concepts can come apart, and the term 'feature' has a specific meaning that goes beyond the general meaning of 'variable' as employed in statistics more generally.
In short, a feature is some measurable property or characteristic of the data that is used as input for a machine learning algorithm to make predictions or decisions.
In a simple example, the set of features could be the columns in a dataset that represent properties of an object (e.g. number of doors, colour, and convertible in the previous example).
However, features are not always hand selected by ML engineers.
For more complex algorithms, features can be selected or engineered through computational methods, resulting in features that are not readily interpretable by humans due to their lack of semantic meaning.
As such, the variables contained in training datasets, may end being the same as the variables (or, features) that are used as inputs into the model, but this does not have to be the case. In other cases, many of the original set of variables that may be explored during initial data analysis can be discarded based on their lack of relevance or contribution to model performance. Therefore, in machine learning, the term 'feature' is used specifically to refer to those input variables that are used for making predictions.
We won't belabour the well-trodden point about correlation not equalling causation in this section. However, it is a useful means for drawing attention to the limitation of model interpretability methods to explain causal relationships between the input features and the model's predictions, among other types of explanations (e.g. explanations about data collection issues, or project governance choices). Moreover, it serves as a gentle reminder about the importance of understanding the limitations of any tool before using it.
In this section, we will explore the more technical aspects of explainability, which rely on the interpretability of the underlying model (including its development and architecture). This section does not go into the practical details of how to use interpretability methods, but does provide a brief overview of some of the most common methods and tools. As always, the focus is on the ethical implications of these methods and how they help promote a responsible approach to data science and AI research and innovation.
What is model interpretability?
In the opening section of this module, we introduced the following definition of interpretability to help distinguish it from explainability:
Interpretability is the degree to which a human can understand the cause of a decision.2
In this section specifically, when we use the term 'interpretability' we will be referring to model interpretability, which is the degree to which a human can understand the cause of a model's prediction or behaviour. However, it is also appropriate to use the term 'interpretability' to refer to other components of a machine learning system, such as the data or the behaviour of the system itself, which may depend on several models working in concert.
Methods for Interpreting Models
There are many methods for interpreting models. Before we look at a way for categorising them, let's just start with a look at some examples that are loosely representative of the myriad techniques currently available.
Overlaps
When reading the following list, you may think that some of the techniques resemble one another. You may also find it hard to notice a substantial difference at all. If this is the case, do not fret, we will look at a taxonomy shortly that will help bring some conceptual clarity to the miscellany of techniques.
- Rule-based models: models that use simple decision rules to arrive at predictions (e.g. decision trees). The rules are often represented in a human-readable format.
- Linear models: models where the relationship between the input variables and output variables can be expressed though a simple equation, and the coefficients enable a human to interpret the relative importance of each input variable (e.g. weights in logistic regression models).
- Feature importance techniques: techniques that can be used to identify the input variables that are most important for making predictions. Various techniques exist, such as permutation importance (i.e. repeated and random permutation of the values of each input feature to observe how this affects the model's predictions) or sensitivity analysis (i.e. observing sensitivity of a model to variations in specific features). As we will see shortly, feature importance techniques can vary in terms of their scope (i.e. local versus global measures of importance).
- Prototypes and criticisms: a technique for explaining how a model classifies instances by first generating 'prototypes' of each class, which are both representative of the class members and, ideally, as differentiable from the other classes as possible. In contrast, 'criticisms' are instances that do not belong to the class to which they were assigned. Both prototypes and criticisms can be informative in understanding where a model is working well and poorly.
- Surrogate models: a technique that aims to generate simplified, interpretable models that emulate the predictions of a more complex model (e.g. black box models). Surrogate model techniques, such as LIME, can help data scientists and machine learning engineers gain insights into how a more complex model operates.
- Visualisations: there are many visualisation techniques, familiar to data analysts, that can also help display the outputs of other techniques, such as feature importance, in formats that improve interpretability.
- Concept activation vectors: a model-specific technique for neural networks, where a user identifies a concept of interest, and explores how this concept is activated across the neural network by applying several additional techniques (e.g. training supplementary classifiers on a subset of data to predict the behaviour of the underlying neural network). Here, 'concept' is a high-level abstraction, which could be made up of many lower-level features in the model (e.g. the concept of 'ears' in a neural network designed to classify images of animals).
- Counterfactual explanations: a counterfactual explanation shows how the output of a model (e.g. prediction) would change if the input data were different.
- Bayesian networks: the benefit of Bayesian networks is their ability to model the conditional dependencies between input features and output variables. Like counterfactual explanations, Bayesian networks can be a useful tool for building causal explanations, when used carefully and with a robust understanding of the data, problem, and the limitations of the tools.
Causal Inference in Machine Learning and AI
The topic of causal inference in machine learning and AI is a well-studied area of research, but is not within the scope of this section or module.
For more information, see the following resources:
- Pearl, J. and Mackenzie, D. (2018). The book of why: The new science of cause and effect. https://www.penguin.co.uk/books/289825/the-book-of-why-by-judea-pearl-and-dana-mackenzie/9780141982410
- Sgaier, S. K., Huang, V., and Charles, G. (2020). The case for causal AI. Stanford Social Innovation Review. https://ssir.org/articles/entry/the_case_for_causal_ai
- Forney, A. and Mueller, S. (2022). Causal inference in AI education: A primer. Journal of Causal Inference. https://www.degruyter.com/document/doi/10.1515/jci-2021-0048/html
Understanding types of interpretability methods
Now that we have seen some specific examples of model interpretability methods, let's try to bring some conceptual order to the landscape. Christopher Molnar's excellent book on Interpretable ML provides several useful ways to differentiate model interpretability, which we will take as our starting point:
- Intrinsic vs Post Hoc
- Model-specific vs model-agnostic
- Global vs Local
- Results of interpretability methods
It is important to note that while grouped together into a taxonomy, the four pairs of categories are not necessarily of the same type. For instance, 'model-specific vs model agnostic' refers to a means for understanding the method by which interpretability is achieved, whereas 'results of interpretability methods' refers to the type of output that is produced by the interpretability method. The taxonomy is nevertheless highly informative, and so we will now look at each of the elements in further detail.
1. Intrinsic versus post hoc
Intrinsic interpretability is a property of a model that can be measured on a scale from the class of models that are intrinsically interpretable (e.g. simple logistic regression models used for binary classification), through to the class of models that are highly complex and have very low (to no) intrinsic interpretability (e.g. large language models). For example, the following decision tree would have high levels of intrinsic interpretability because of its simple structure.
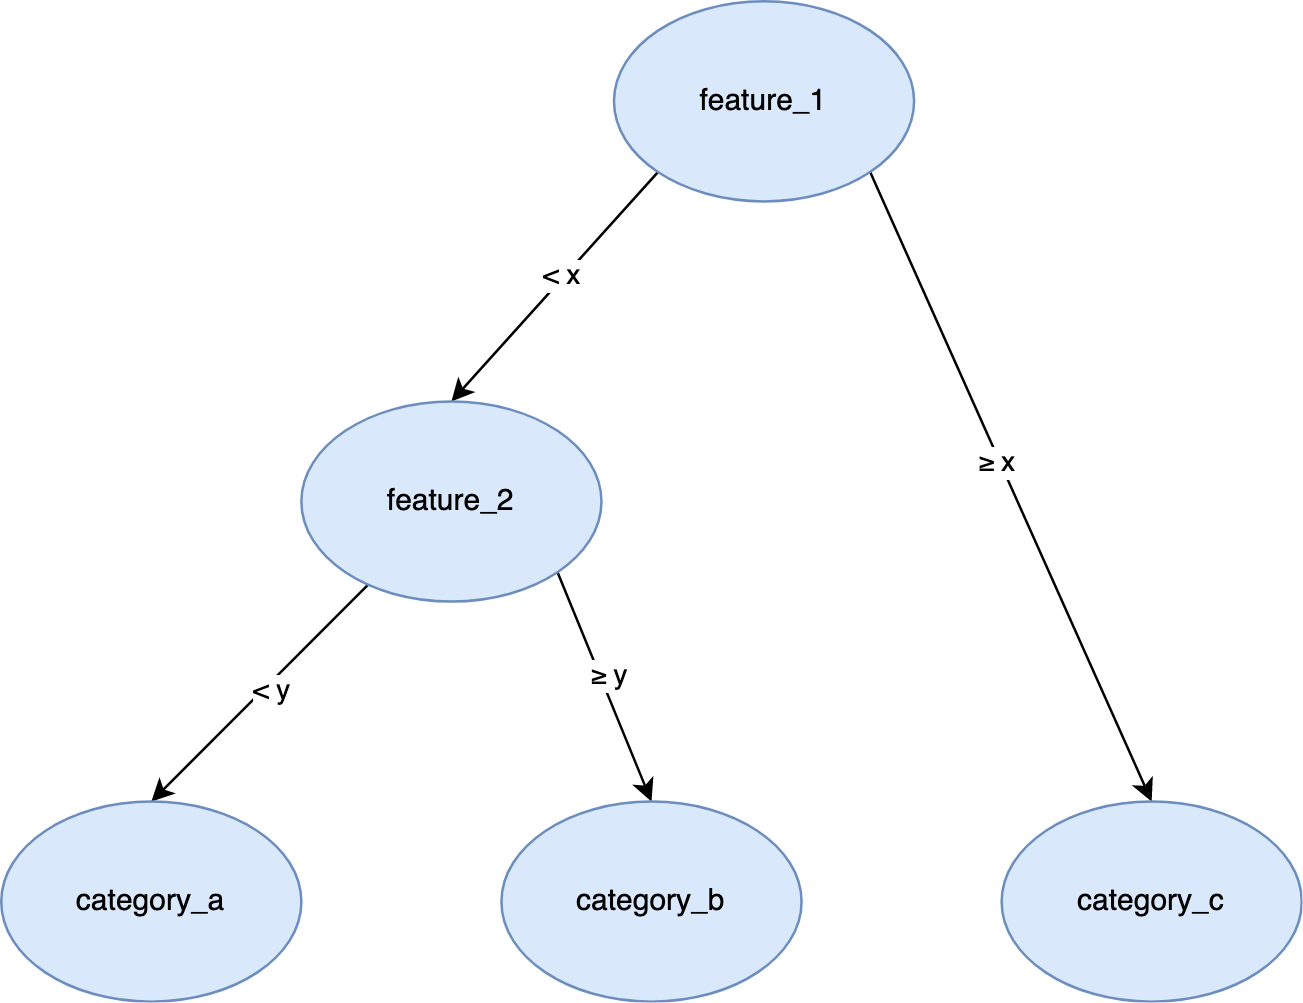 A graphic showing a decision tree where the branches split based on whether a feature exceeds some threshold or not.
In contrast, post hoc interpretability is a property of the model that is dependant on the application of additional methods or techniques applied after a model's training (hence, post hoc). For example, random forests—a type of machine learning method known as an 'ensemble method' because it combines the predictions of several simpler models (i.e. decision trees) to predict an outcome (based on the consensus among the different trees within the forest)—have low levels of intrinsic interpretability. However, post hoc methods (e.g. LIME) can be applied to help extract interpretations about, say, the importance of specific features, which would otherwise be too complex to extract.
Clarifications
Two clarifications are worth making:
- These two types of interpretability are not mutually exclusive. Post hoc methods can also be applied to intrinsically interpretable models to improve interpretability.
- Intrinsically interpretable models may also depend on the use of techniques to improve interpretability that have been applied prior to training (e.g. feature engineering) for the model to remain intrinsically interpretable. As such, they are not strictly speaking 'post hoc' in the sense of being applied after a model has been developed.
2. Model-specific versus model-agnostic
There are a variety of ML models, ranging from simple logistic regression through gradient boosting and to more complex forms of reinforcement learning involving linked neural networks. The application of interpretability techniques and methods is sometimes constrained by the choice of model. For instance, integrated gradients for neural networks is a technique for visualising feature importance, as is the case with the following image, where the technique allows the interpreter to see which pixels were important in an image classification task.
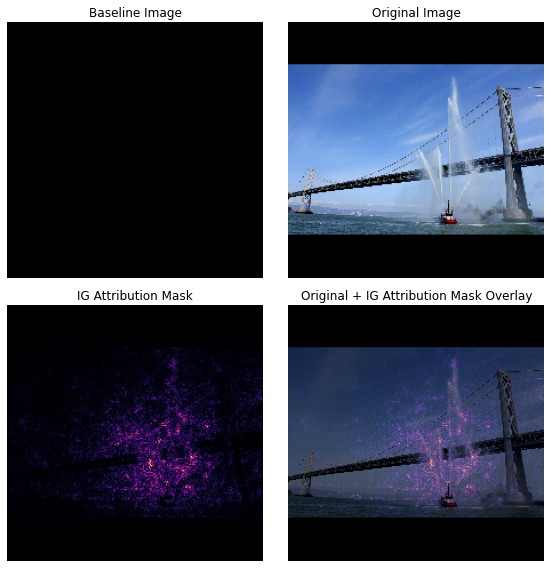
An example of an integrated gradients technique showing which parts of an image were important in determining the output of a classification task. Reprinted from TensorFlow.
This is an example of a model-specific method, because it requires a calculation to be carried out on specific elements of the underlying neural network, and this method would not apply to other models that have different internal structures. This is the case even if the objective of determining feature importance is similar to the goal of other methods that enable the interpretation of feature importance (e.g. LIME).
In contrast, model agnostic methods can be used for any model. As such, they do not utilise any structural information about the model, but typically treat the algorithm as a black box and just focus on understanding which data, inputs, or features were important in the model's prediction.
A common model agnostic method is to compute a partial dependence plot (PDP) to help visualize the relationship between a feature and a model's prediction. It shows how the model's prediction changes as the value of a feature changes, holding all other features constant.
Cautionary Tale Redux
Recall the cautionary tale at the start of this section! Model agnostic methods, such as PDPs, may not help uncover any causal relationships between features and outcomes, as the following example (reprinted from Molnar (2019)) shows:
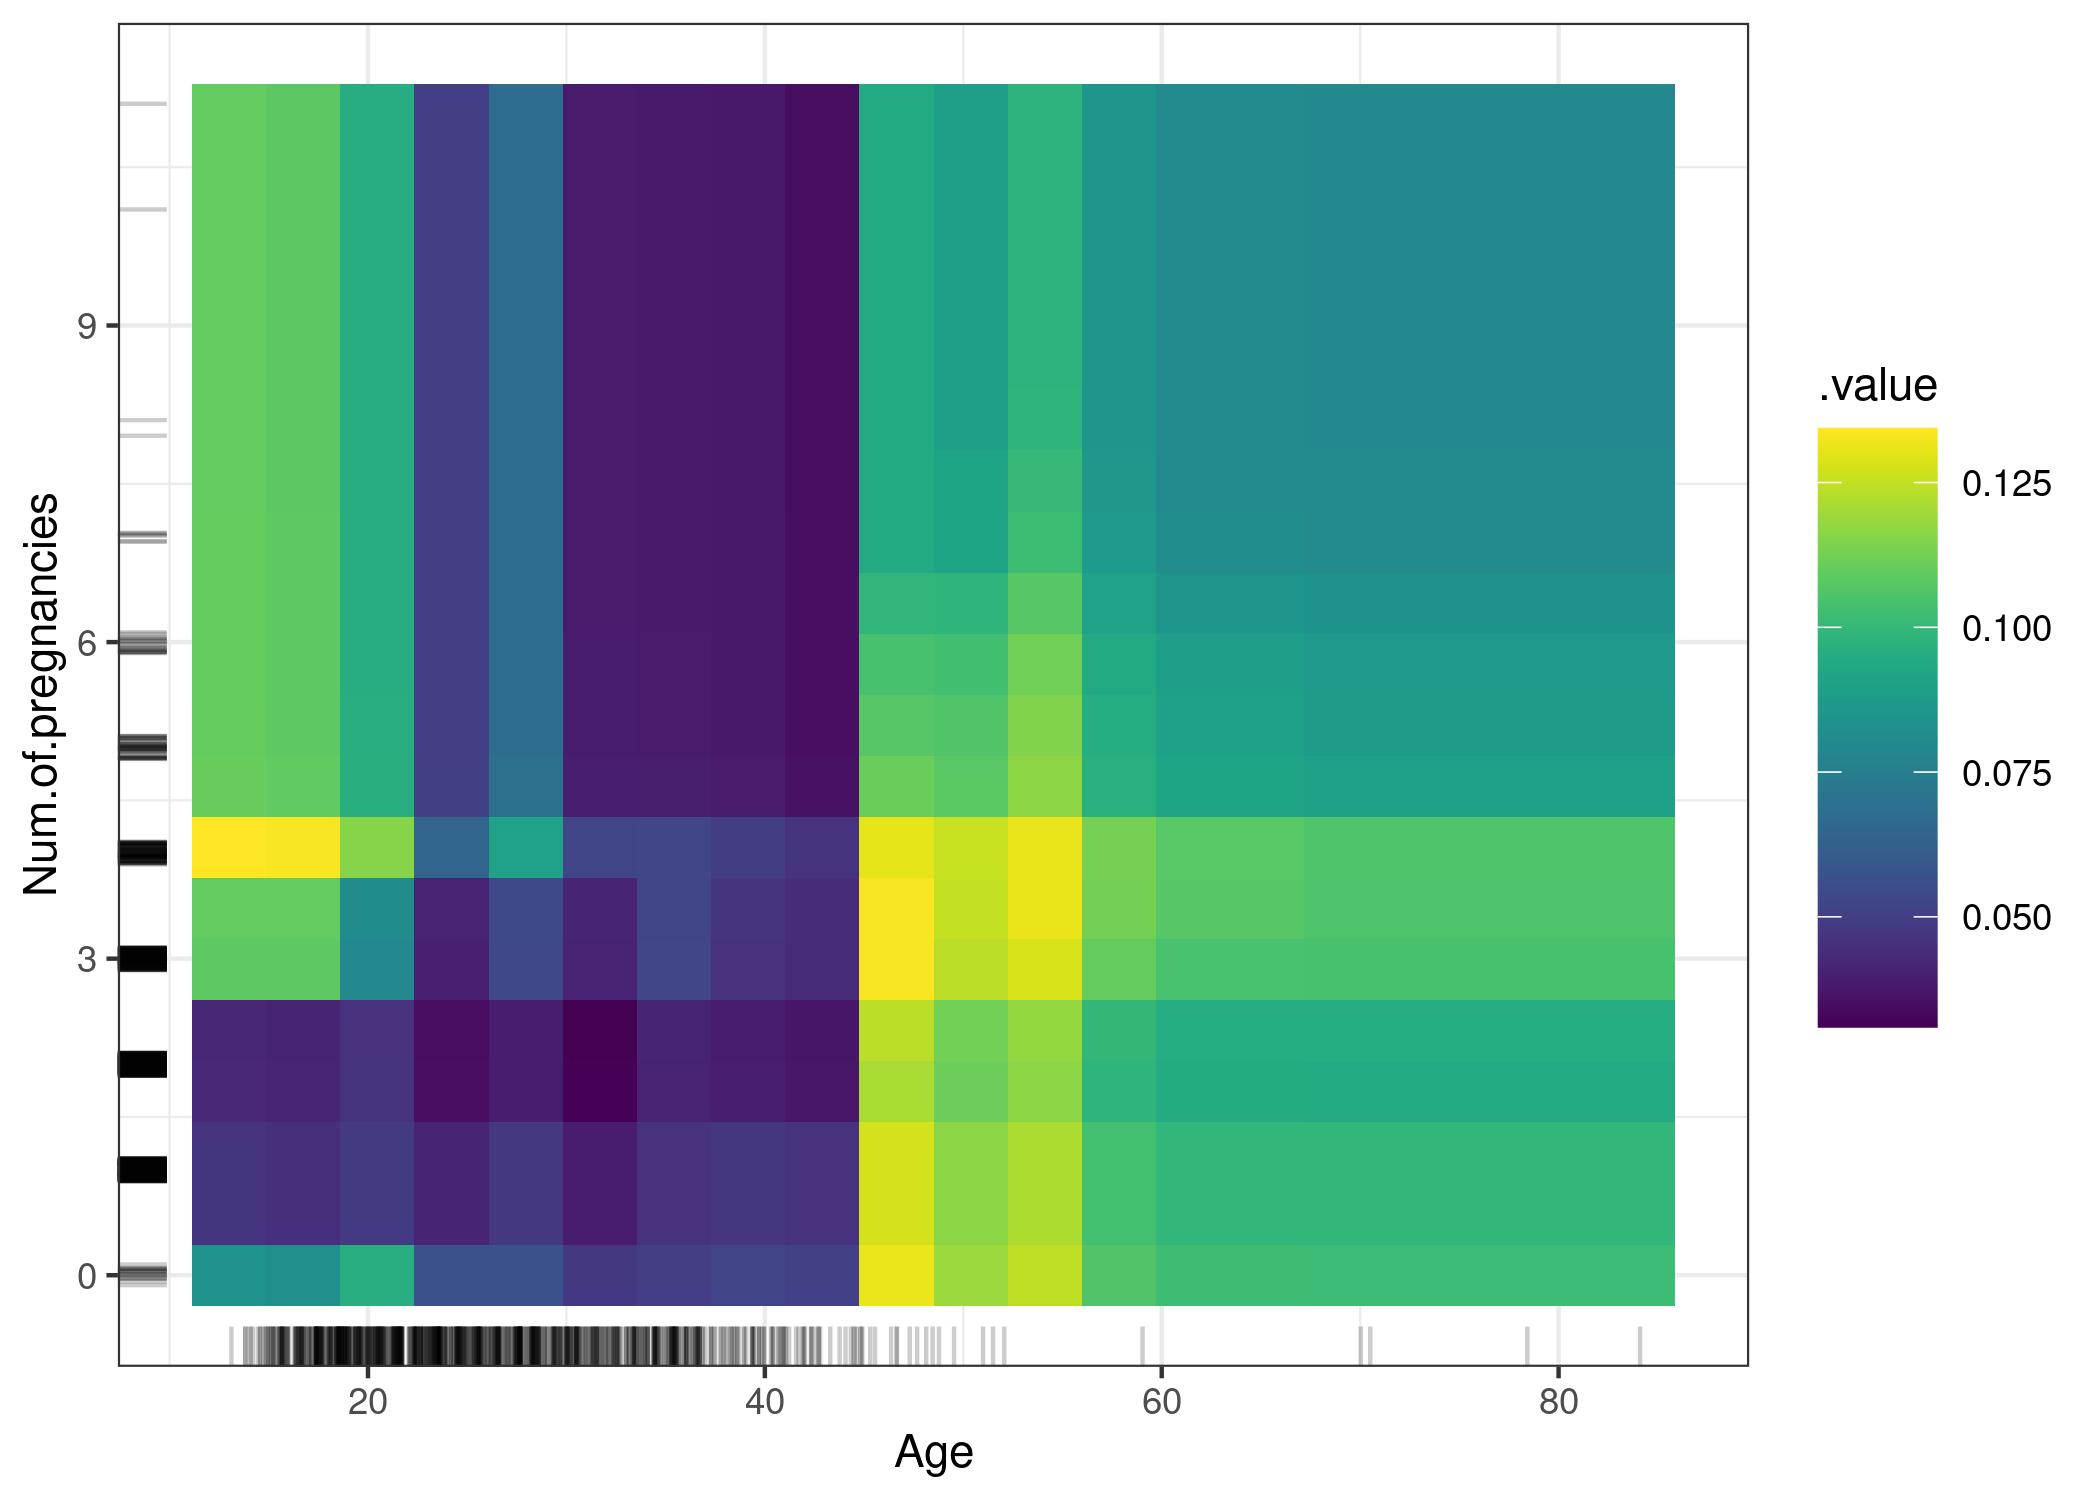 PDP of cancer probability and the interaction of age and number of pregnancies. The plot shows the increase in cancer probability at 45. For ages below 25, women who had 1 or 2 pregnancies have a lower predicted cancer risk, compared with women who had 0 or more than 2 pregnancies. But be careful when drawing conclusions: This might just be a correlation and not causal!
3. Global Versus Local
We also have the distinction between local and global scope of interpretability methods.
The example of the partial dependence plot given in the previous section was an example of a global method. This is because it helps individuals to interpret the relationship between a feature and a model's prediction, independent of any specific observation. In other words, it focuses on the global interpretability of the model itself.
In contrast, there are also local methods that help interpret why specific predictions were made for a particular observation. Rather than focusing on the model itself, here the focus is on an individual data point or observation.
Both types of interpretability are likely to be useful, but for different circumstances. For instance, let's assume a user receives a classification that they wish to contest. Here, local interpretability methods can help the system owner understand why a particular instance (perhaps their data point) was classified as belonging to one bucket, rather than another. This type of interpretation is likely to be more relevant in forming an explanation that is deemed adequate by the affected user than an explanation that is supported by a global interpretation.
However, if an auditor or procurer is looking to assess the overall robustness and validity of a model as part of an evaluation process, they are more likely to want to understand, say, the overall relationships between features and predictions, which can be generated by global interpretability methods.
4. Outcomes of Interpretability Methods
Finally, Molnar introduces five different outcomes that can be realised through the application of interpretability methods. These are:
- Feature summary statistics: a variety of metrics that can be used to help quantify the importance of features (e.g. a score that shows the increase in prediction error following permutation to a feature's value), or a pairwise interaction strength between two features.
- Feature summary visualisations: a different representational format that can also be used to help illustrate many of the feature summary statistics, in a way that can be more meaningful to a human.
- Model internals: values or information used to represent some element in the model's structure, such as its parameter (e.g. weights and biases). For intrinsically interpretable models, such as linear regression models, this is how the model is said to be interpretable.
- Data points: techniques that return data points as output fall under this category. For instance, counterfactual explanations return a data point that is similar to the data point being queried, but where the variation results in a different prediction.
- Intrinsically interpretable models: an interpretable model itself constitutes a result of some method, even if the method was to explicitly choose to develop a model that required no additional post hoc methods to be applied.
You will notice that the first three types overlap and intersect with these five categories of outcomes. Again, this is because the taxonomy Molnar provides is not designed to provide a set of categories or types that are both mutually exclusive and jointly exhaustive. Rather, the taxonomy provides many overlapping and complementary perspectives on the different types of interpretability methods that are available.
Model Interpretability and Responsible Research and Innovation
By now you will have identified some of the benefits and limitations of model interpretability. Let's now embed this understanding in the context of responsible research and innovation.
Understanding your data
While the term 'model interpretability methods' would suggest that the focus is on understanding the model itself, by now you will realise this is not always the case. Rather, model interpretability methods can also be a powerful tool for better understanding your data. For instance, interpretable ML methods can:
- Provide insights into which input variables are most important for forming predictions
- Help a project team identify errors, biases, or gaps in their dataset (e.g. missing data)
- Identify patterns in large, complex, or high-dimensional datasets that would otherwise be too difficult for humans to recognise
However, these benefits depend upon a crucial step in the project lifecycle: selecting the right interpretability method.
As the above taxonomy demonstrates, not all methods are created equally and selecting the right tool for the job remains an important maxim. For example, in many datasets, there will be complex, non-linear relationships between the input variables. Therefore, a narrow focus on local techniques that help user's interpret the contribution of a single feature to a prediction will not help disclose how, say, a positive weight for one individual feature depends on the existence of a negative weight for some other feature. As Molnar states:
The interpretation of a single weight always comes with the footnote that the other input features remain at the same value, which is not the case with many real applications. A linear model that predicts the value of a house, that takes into account both the size of the house and the number of rooms, can have a negative weight for the room feature. It can happen because there is already the highly correlated house size feature. In a market where people prefer larger rooms, a house with fewer rooms could be worth more than a house with more rooms if both have the same size. The weights only make sense in the context of the other features in the model.3
This is why the other sections of this module emphasise the importance of a broader awareness of the project lifecycle and the sociocultural context in which the project operates as a crucial means for situating explanations (more on this in the next section).
Building Explanations
As we will see in the next section, multiple explanations for a system's behaviour may be required, depending on the recipient of the explanation. Therefore, in contrast to the above points about choosing the right tool for the job, here the plurality of methods can (in some cases) be a benefit.
For instance, concept activation vectors may be very useful for a team of ML engineers who are communicating results to another team of ML engineers working in a separate research institution. However, if the original team decide to do public engagement and outreach they may need to rely on simpler forms of feature importance, surrogate models, or visualisations to help generate an accessible explanation.
Therefore, while the maxim, 'choose the right tool for the job' still applies, it is also important to recognise that there may be multiple tools required for different explanatory purposes.
Here again, we see a major difference between our use of the terms 'interpretability' and 'explainability'. Whereas we reserve the concept of interpretability for the methods and techniques that are used to understand the inner workings of a model (or system), explainability has a broader scope and refers to any process or mechanism across the whole project lifecycle that supports communication and reason-giving between project team members and stakeholders.
Accountability and Transparency
Consider the following question.
Question
Why would a stakeholder or user request an explanation for a model's behaviour or the outcomes of an AI system?
Perhaps they're just interested and want to understand how different types of machine learning models work. But aside from curiosity and education, there are several other important reasons why stakeholders and users may request an explanation. These include:
- Compliance: stakeholders may need to demonstrate that their AI system is compliant with a particular regulation or standard before adopting it in a production environment.
- Bias detection: groups that are under-represented in a dataset may be at a greater risk of being misclassified by a model. Therefore, understanding how a model makes predictions can help stakeholders (and team members) carry out bias detection and mitigation tasks, as a broader part of equality impact assessments.
- Risk management and redress: regulators have a duty to protect the public from various types of harm. Therefore, model interpretability methods can play an important role in the broader mechanisms of project transparency, which can a) feed into risk management activities, and b) be used retrospectively if some harm occurs and redress for the (possibly unintended) harm is required.
These non-exhaustive examples demonstrate how model interpretability methods also feed into broader objectives of responsible research and innovation, such as accountability and transparency.
We cover these topics in more detail in a separate module (Note: this module is coming soon).
Now, let us turn to the final section of this module to explore how we can bring all of this knowledge together to help us build (situated) explanations.
-
The scenario is adapted and summarised from the same case presented in this article. ↩
-
Miller, T. (2019). Explanation in artificial intelligence: Insights from the social sciences. Artificial intelligence, 267, p. 1-38. https://doi.org/10.1016/j.artint.2018.07.007 ↩
-
Molnar, C. (2022). Interpretable Machine Learning. A Guide for Making Black Box Models Explainable. https://christophm.github.io/interpretable-ml-book/scope-of-interpretability.html ↩