2.7 Data analysis with classes
Contents
2.7 Data analysis with classes#
Estimated time to complete this notebook: 10 minutes
Earlier, we wrote some code to measure the amount of green content on satellite images. Now, we’re going to convert this into a “Greengraph” class, and save it as a module.
⚠️ It is generally a better idea to create files in an editor or integrated development environment (IDE) rather than through the notebook! ⚠️
2.7.1 Classes for Greengraph#
%%bash
mkdir -p greengraph  # Create the folder for the module (on mac or linux)
%%writefile greengraph/graph.py
import numpy as np
import geopy
from .map import Map


class Greengraph:
    def __init__(self, start, end):
        self.start = start
        self.end = end
        self.geocoder = geopy.geocoders.Nominatim(user_agent="rsd-course")

    def geolocate(self, place):
        return self.geocoder.geocode(place, exactly_one=False)[0][1]

    def location_sequence(self, start, end, steps):
        lats = np.linspace(start[0], end[0], steps)
        longs = np.linspace(start[1], end[1], steps)
        return np.vstack([lats, longs]).transpose()

    def green_between(self, steps):
        return [
            Map(*location).count_green()
            for location in self.location_sequence(
                self.geolocate(self.start), self.geolocate(self.end), steps
            )
        ]
Overwriting greengraph/graph.py
Note that a line like from .map import Map will import the definition of Map from the file map.py in the current directory.
%%writefile greengraph/map.py

import numpy as np
from io import BytesIO
import imageio as img
import requests


class Map:
    def __init__(
        self, lat, long, satellite=True, zoom=10, size=(400, 400), sensor=False
    ):
        base = "https://static-maps.yandex.ru/1.x/?"

        params = dict(
            z=zoom,
            size=str(size[0]) + "," + str(size[1]),
            ll=str(long) + "," + str(lat),
            l="sat" if satellite else "map",
            lang="en_US",
        )

        self.image = requests.get(
            base, params=params
        ).content  # Fetch our PNG image data
        content = BytesIO(self.image)
        self.pixels = img.imread(content)  # Parse our PNG image as a numpy array

    def green(self, threshold):
        # Use NumPy to build an element-by-element logical array
        greener_than_red = self.pixels[:, :, 1] > threshold * self.pixels[:, :, 0]
        greener_than_blue = self.pixels[:, :, 1] > threshold * self.pixels[:, :, 2]
        green = np.logical_and(greener_than_red, greener_than_blue)
        return green

    def count_green(self, threshold=1.1):
        return np.sum(self.green(threshold))

    def show_green(data, threshold=1.1):
        green = self.green(threshold)
        out = green[:, :, np.newaxis] * array([0, 1, 0])[np.newaxis, np.newaxis, :]
        buffer = BytesIO()
        result = img.imwrite(buffer, out, format="png")
        return buffer.getvalue()
Overwriting greengraph/map.py
%%writefile greengraph/__init__.py
from .graph import Greengraph
Overwriting greengraph/__init__.py
2.7.2 Invoking our code and making a plot#
%matplotlib inline
from greengraph import Greengraph
from matplotlib import pyplot as plt
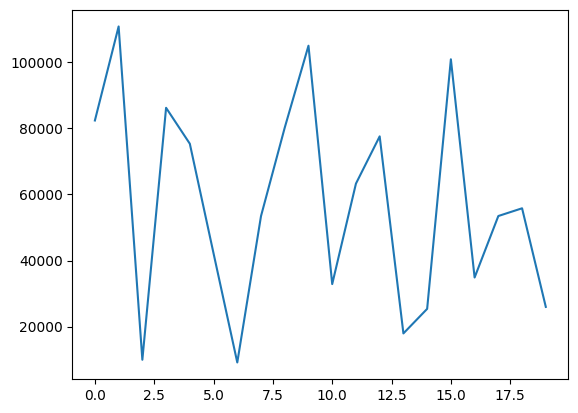
mygraph = Greengraph("New York", "Chicago")
data = mygraph.green_between(20)
plt.plot(data)
[<matplotlib.lines.Line2D at 0x7f26c4db72e0>]